Webhook
Webhook allows you to send traces to any HTTP endpoint that can receive JSON payloads. This is useful for integrating with custom observability systems, internal tools, or any service that accepts HTTP requests.
Step 1: Set up your webhook endpoint
Create an HTTP endpoint that can receive POST or PUT requests with JSON payloads. Your endpoint should:
- Accept
application/jsoncontent type - Return a 2xx status code on success
- Be publicly accessible from the internet
The endpoint will receive traces in OpenTelemetry Protocol (OTLP) format, making it compatible with any OTLP-aware system.
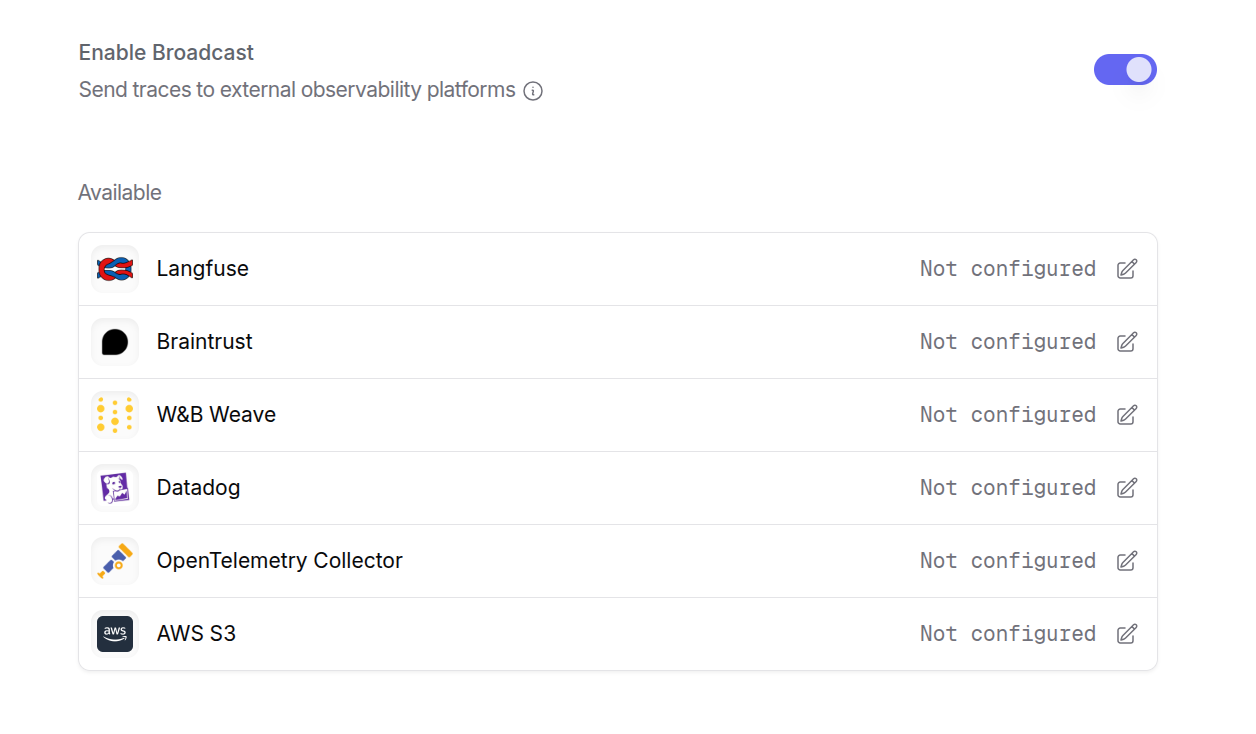
Step 2: Enable Broadcast in OpenRouter
Go to Settings > Broadcast and toggle Enable Broadcast.
Step 3: Configure Webhook
Click the edit icon next to Webhook and enter:
- URL: Your webhook endpoint URL (e.g.,
https://api.example.com/traces) - Method (optional): HTTP method to use, either
POST(default) orPUT - Headers (optional): Custom HTTP headers as a JSON object for authentication or other purposes
Example headers for authenticated endpoints:
Step 4: Test and save
Click Test Connection to verify the setup. The configuration only saves if the test passes. During the test, OpenRouter sends an empty OTLP payload with an X-Test-Connection: true header to your endpoint.
Your endpoint should return a 2xx status code for the test to pass. A 400 status code is also accepted, as some endpoints reject empty payloads.
Step 5: Send a test trace
Make an API request through OpenRouter and verify that your webhook endpoint receives the trace data.
Payload format
Traces are sent in OTLP JSON format. Each request contains a resourceSpans array with span data including:
- Trace and span IDs
- Timestamps and duration
- Model and provider information
- Token usage and cost
- Request and response content (with multimodal content stripped)
Example payload structure:
Use cases
The Webhook destination is ideal for:
- Custom analytics pipelines: Send traces to your own data warehouse or analytics system
- Internal monitoring tools: Integrate with proprietary observability platforms
- Event-driven architectures: Trigger workflows based on LLM usage
- Compliance logging: Store traces in systems that meet specific regulatory requirements
- Development and testing: Use services like webhook.site to inspect trace payloads
For production use, ensure your webhook endpoint is highly available and can handle the expected volume of traces. Consider implementing retry logic on your end for any failed deliveries.